Defensive vs. Enterprising Investor — Match Portfolio to Temperament
Benjamin Graham separates investors into two perfectly respectable types:
- Defensive investors prefer simplicity, steadiness, and low maintenance.
- Enterprising investors are willing to accept more volatility and hands-on effort for the chance at somewhat higher returns.
Neither camp is “better.” The right choice is the one you can stick with for decades — through booms, busts, and boring middles. This post explains how to find your fit, what to expect from common stock/bond mixes, and gives you a reproducible chart that compares a 60/40 (more defensive) with an 80/20 (more enterprising) portfolio.
What actually changes between Defensive and Enterprising?
1) Risk and return expectations
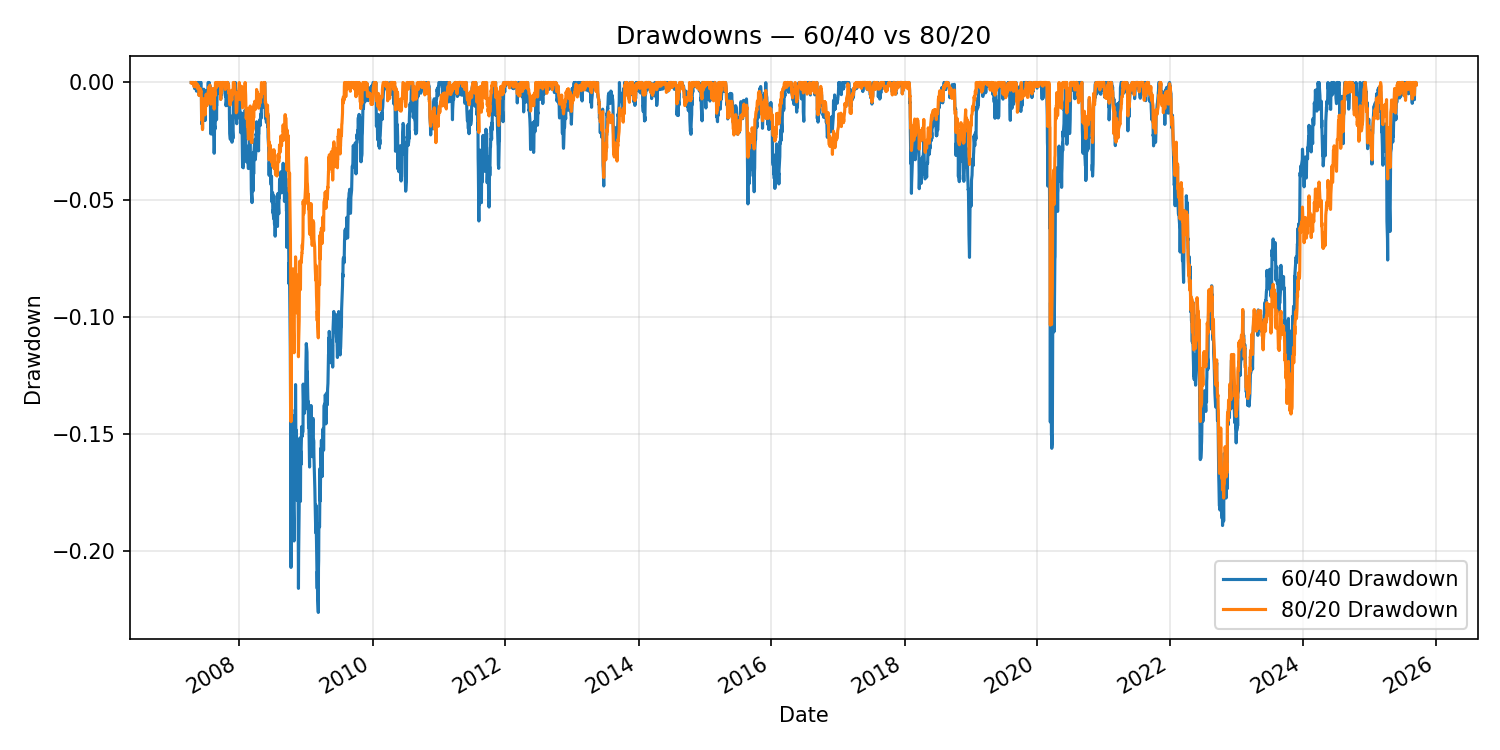
- Higher stock weight (e.g., 80/20) usually means higher long-term return, higher volatility, and deeper drawdowns.
- Lower stock weight (e.g., 60/40) smooths the ride and reduces worst-case losses — at the cost of some return.
2) Your day-to-day experience
- Defensive: fewer gut-checks, easier to ignore headlines, simpler rebalancing.
- Enterprising: you’ll feel the market more; sticking to the plan matters even more.
3) Behavior under stress
- The best portfolio is the one you won’t abandon at the worst possible moment. If a 30% drop makes you lose sleep, your mix is probably too aggressive.
A quick self-check (be honest!)
Answer each “mostly true” = 1 point.
- Big market drops don’t faze me; I’ve stayed invested before.
- I have a stable income and a long time horizon (10+ years).
- I’m comfortable seeing my portfolio drop 25–35% without changing course.
- I enjoy reading about markets and can ignore daily noise.
-
I won’t need to spend this money in the next few years.
-
0–2: Consider a Defensive tilt (e.g., 60/40, 50/50).
- 3–5: You can likely handle an Enterprising tilt (e.g., 70/30, 80/20).
There’s nothing wrong with starting more defensive and increasing equity gradually as your confidence grows.
How a modern tool helps you choose (and stick to it)
- Risk & scenario views: See realistic drawdowns and recovery timelines for 60/40 vs. 80/20 before you choose.
- Allocation guidance: Find a mix that matches your actual tolerance, not your aspirational one.
- Rebalancing discipline: Gentle, rules-based nudges keep your risk aligned over time.
- Clarity over complexity: Visuals and plain-language summaries replace guesswork with understanding.
The point isn’t to time markets — it’s to set a plan you can live with and execute it consistently.
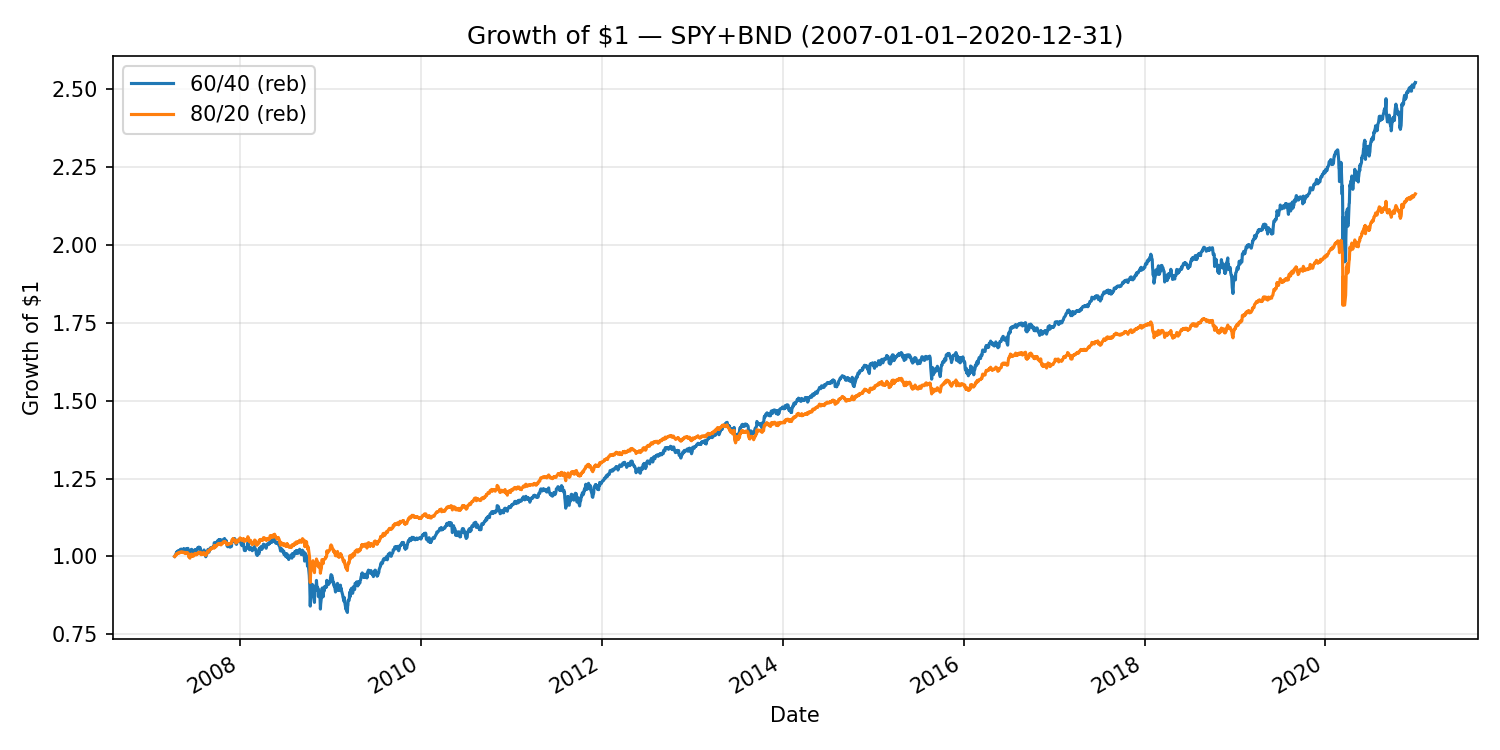
Reproducible experiment: 60/40 vs. 80/20 (SPY/BND)
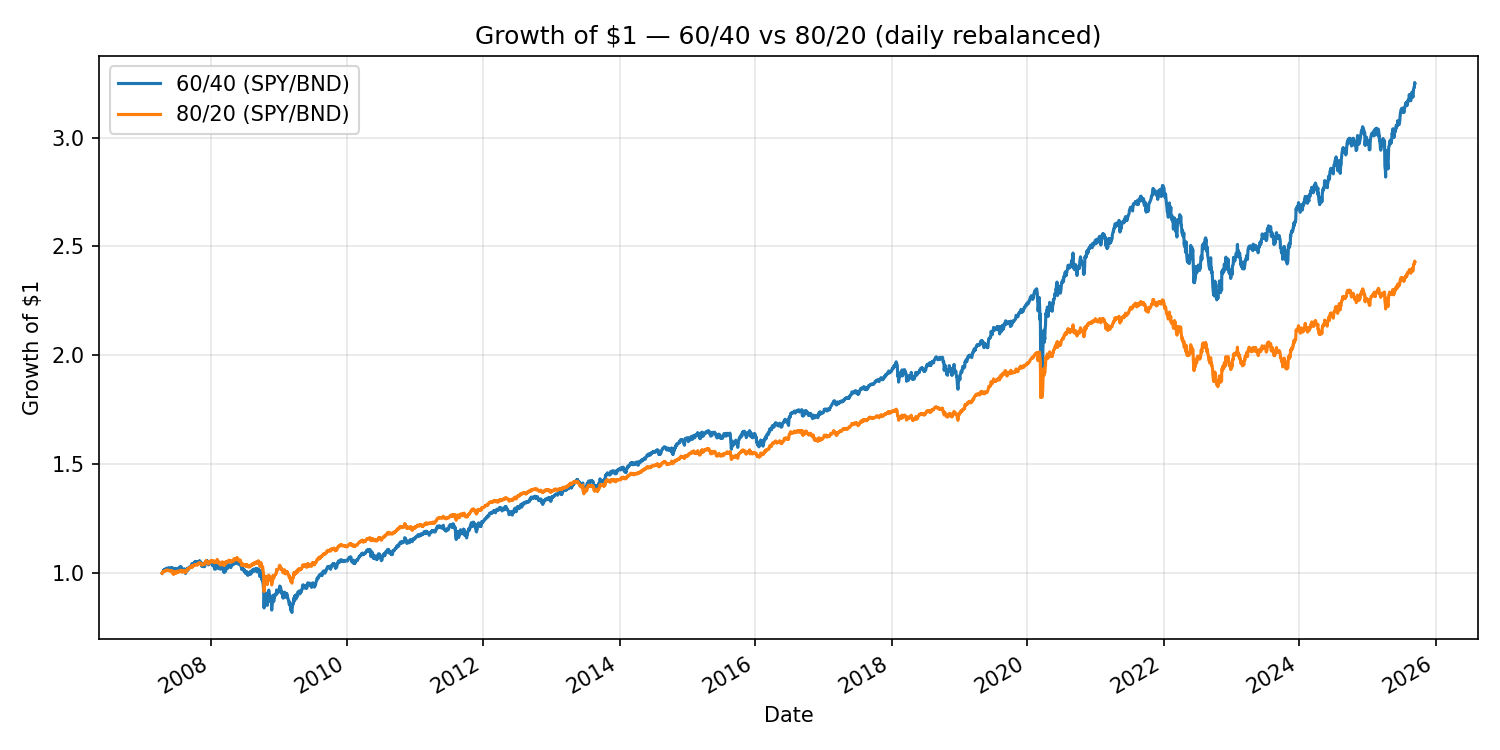
Reality check: does 60/40 ever beat 80/20?
Short answer: sometimes, depending on time window, bond choice, and rebalancing assumptions.
- Sample-period effect: If your window includes an early equity crash (e.g., 2008) and a strong bond tailwind (falling rates), 60/40 can match or beat 80/20.
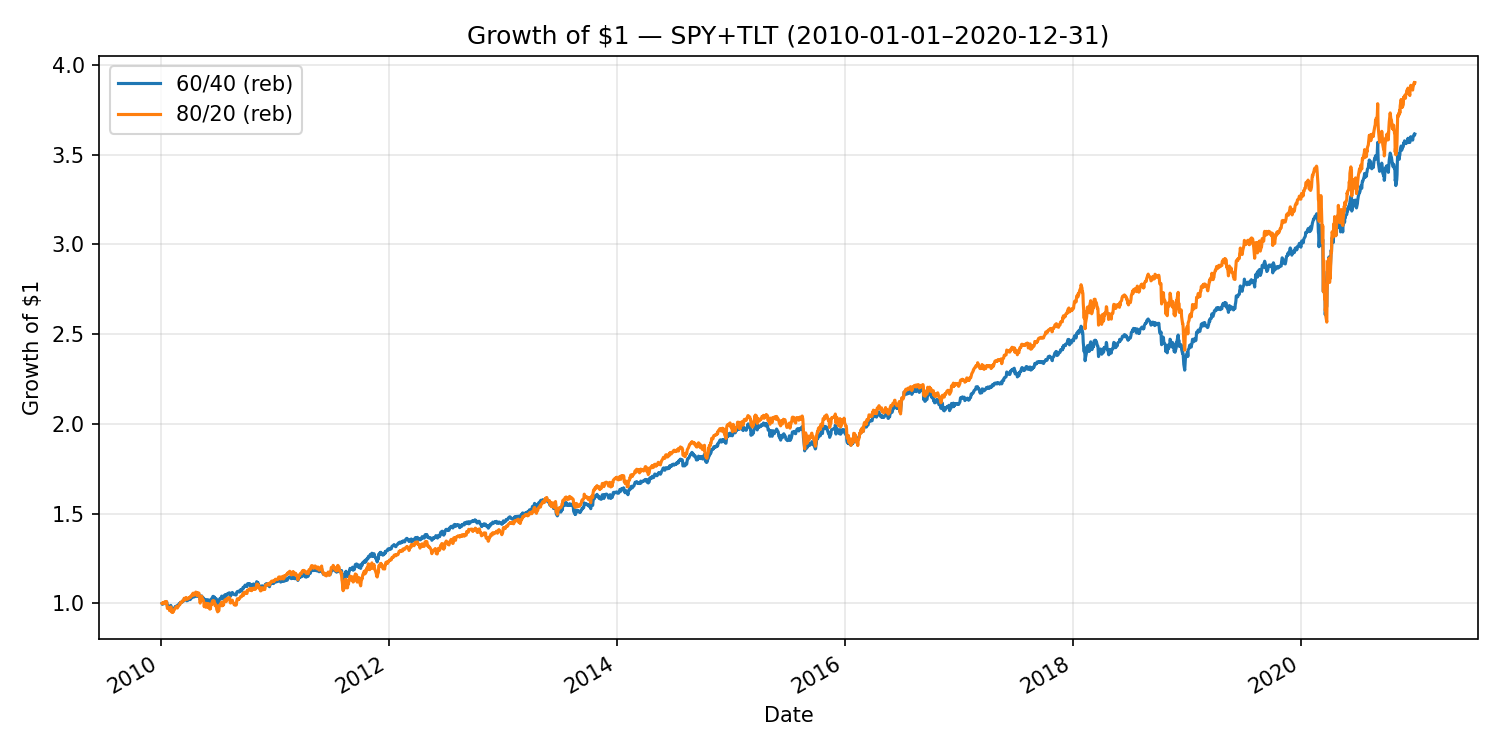
- Bond proxy matters: Long-duration bonds (e.g., TLT) can shine when rates fall, narrowing the gap with higher-equity mixes.
- Rebalancing vs drift: Letting weights drift in a bull market increases effective equity exposure and may boost returns — but that’s a risk change, not free alpha.
The key is understanding why results differ, not cherry-picking the period where “your” mix wins.
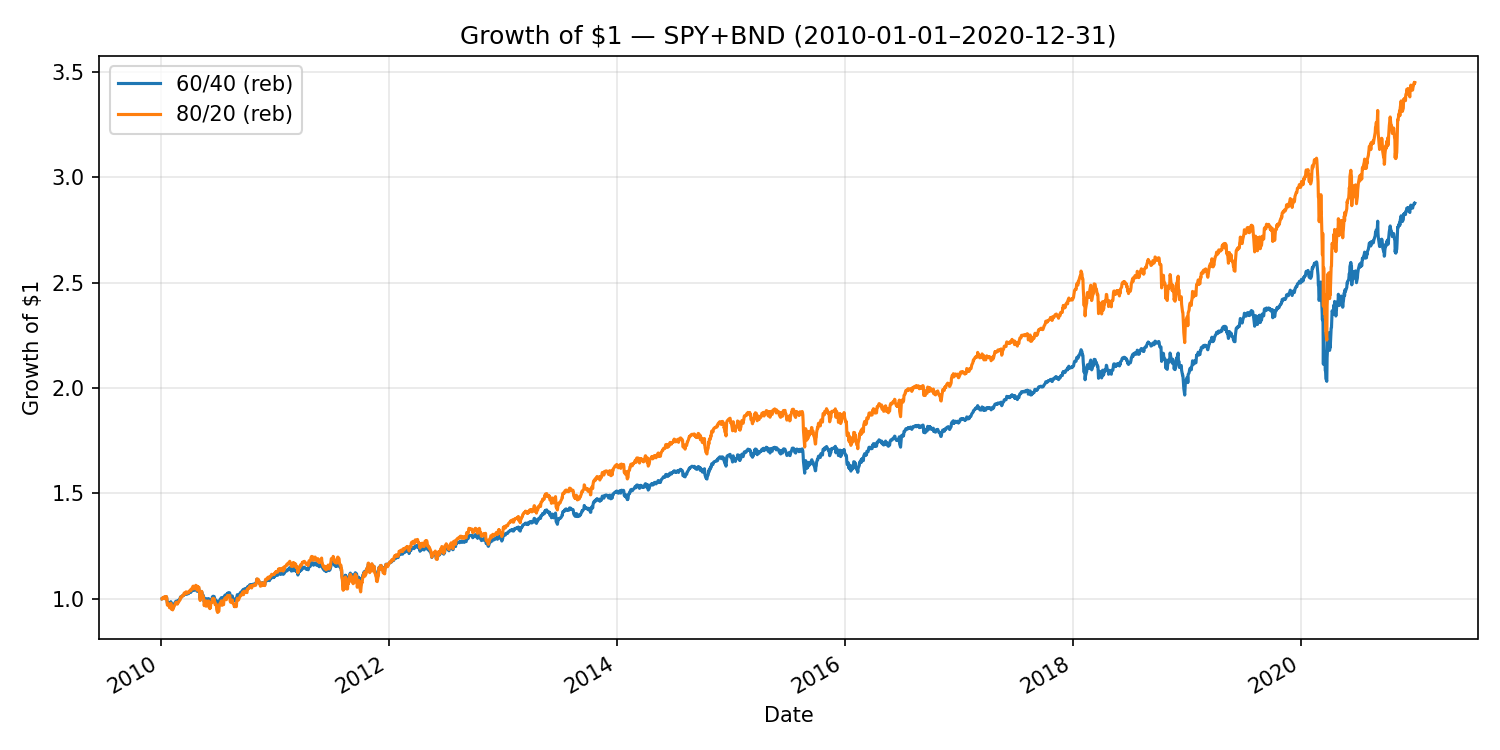
2010–2020 (equity bull) — what actually happens?
In the strong equity decade of 2010–2020, using broad core bonds (e.g., BND), the 80/20 portfolio typically outperforms 60/40 on return (with higher volatility and drawdowns). Using long-duration bonds (e.g., TLT) narrows that gap because falling rates helped TLT a lot.
Include 2008 and watch the story change
Extend the window back to 2007–2020 and you’ll often see 60/40 close the gap or even win in some setups. That’s the sequence-of-returns effect: large early losses hit higher-equity mixes harder, while bonds had a big tailwind.
What to conclude from these results
- Over very long horizons, higher equity weights usually carry higher expected returns — but there are normal periods where the more balanced mix wins.
- Risk and behavior matter as much as return: if deeper drawdowns make you abandon ship, a smoother mix can leave you better off in practice.
- Methodology matters: Use Adjusted Close (total return), be explicit about rebalancing vs drift, and know your bond proxy — they can all move the needle.
Practical tips (pick once, follow always)
- Use the sleep test: If a 25–35% drop makes you itchy, pick the lower-volatility mix.
- Put the rule in writing: “I’ll maintain 60/40 within ±5% bands and rebalance quarterly.”
- Rebalance with cash flows first: New contributions and dividends can fix most drift with fewer taxes.
- Revisit when life changes: Big changes in horizon or income may justify a new mix — not headlines.
- There’s a middle ground: 70/30 can be a nice bridge if you’re not sure yet.
Bottom line
Defensive and Enterprising are two valid paths to the same destination. The difference is how bumpy the road feels and whether you’ll stay in the car the whole way. Pick the mix that fits your temperament — then let rules and rebalancing carry the load.
← Previous: Margin of Safety (Diversification)
Next: The Behavior Gap »