The Cyclical Nature of the Small Cap Premium
At Libra Invest, we often highlight the small cap premium — the tendency of smaller companies to outperform larger ones over long horizons. But what investors sometimes overlook is that this premium is cyclical. It doesn’t show up every year, or even every decade. Instead, small caps often lag during downturns and lead dramatically in recoveries.
Boom and Bust: A Historical Pattern
Looking at annual returns from 1928 to 2024:
- Rebounds after crises:
- 1933: Small Caps +148%, S&P 500 +50%
- 2003: Small Caps +92%, S&P 500 +28%
-
2009: Small Caps +47%, S&P 500 +26%
-
Crashes during downturns:
- Great Depression (1929–1932): Small Caps fell more than the S&P each year.
- 2008 Financial Crisis: Small Caps –45%, S&P 500 –37%.
This cyclical behavior shows why small caps are both loved and feared: they magnify both losses and gains.
Visualizing the Cycles
The long-term charts make the pattern clear:
- During recoveries, small caps shoot far above large caps.
- During recessions, they sink deeper.
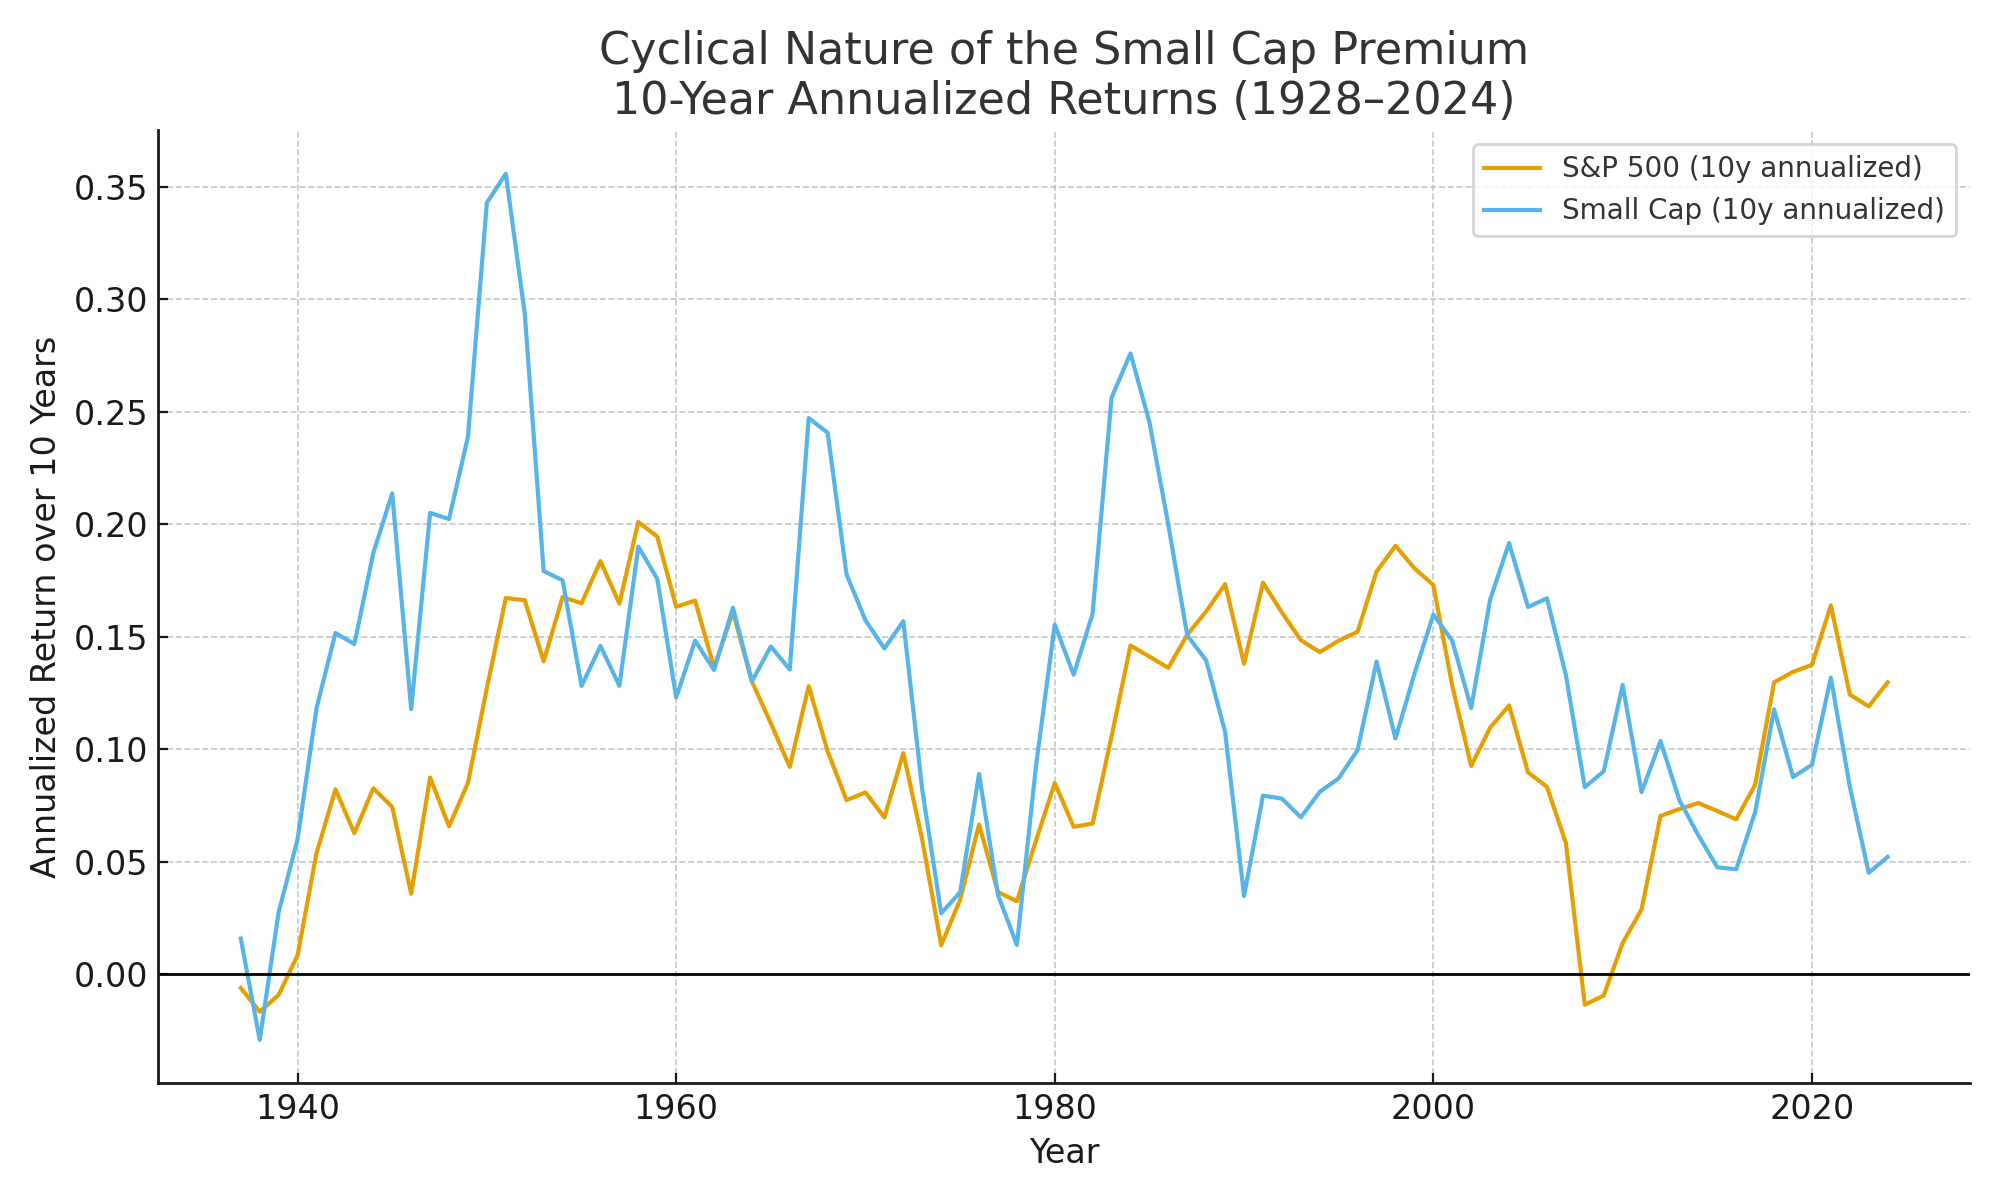
A 10-year rolling return chart highlights these cycles: in some decades small caps were unbeatable, while in others (like parts of the 1980s and 2010s) they barely kept up.
The Investor’s Takeaway
The timing of small-cap exposure matters. Allocating more to small caps after major downturns has historically been one of the most rewarding strategies. But it requires patience, discipline, and the ability to withstand deep short-term drawdowns.
At Libra Invest, we believe the lesson isn’t about predicting cycles perfectly — it’s about understanding them. By recognizing that small cap performance is tied to economic cycles, investors can set realistic expectations and design portfolios that benefit from the rebounds without being derailed by the crashes.