Costs Compound — The Quiet Fee Tax (and How to See It)
Tiny percentages don’t feel scary — 0.50% here, 1.00% there — until they quietly compound against you for years.
Fees are like gravity: always pulling on your compounding. You don’t notice it day to day, but over decades the gap can be huge. Think of fees as a tiny, constant headwind: on any single day it’s barely noticeable, but over thousands of days it pushes you far off course.
This post shows (with two quick charts you can recreate) how to see fee drag clearly — both in a simple 30-year example and on real SPY data — and how to reduce it in practice.
What fees are we talking about?
- Expense ratio (ETF/mutual fund): taken out daily by the fund; you never get a bill — your return is just a bit lower. Over time, that small daily haircut compounds; the fund posts a lower return than the index by roughly the fee amount each year.
- Advisory/platform fee: a % of assets for advice or platform; also taken continuously. Just like fund fees, this compounds against you and stacks on top of the expense ratio if you pay both.
- Trading frictions: spreads/commissions/taxes from frequent trading. These are “hidden” costs because they don’t show up as a line item, but they still reduce the amount that keeps compounding for you.
The first two are the big ones for long-term investors because they compound. Even a 0.50% annual drag becomes a surprisingly large dollar amount across decades.
Figure A — The same 7% market, different fees (30 years)
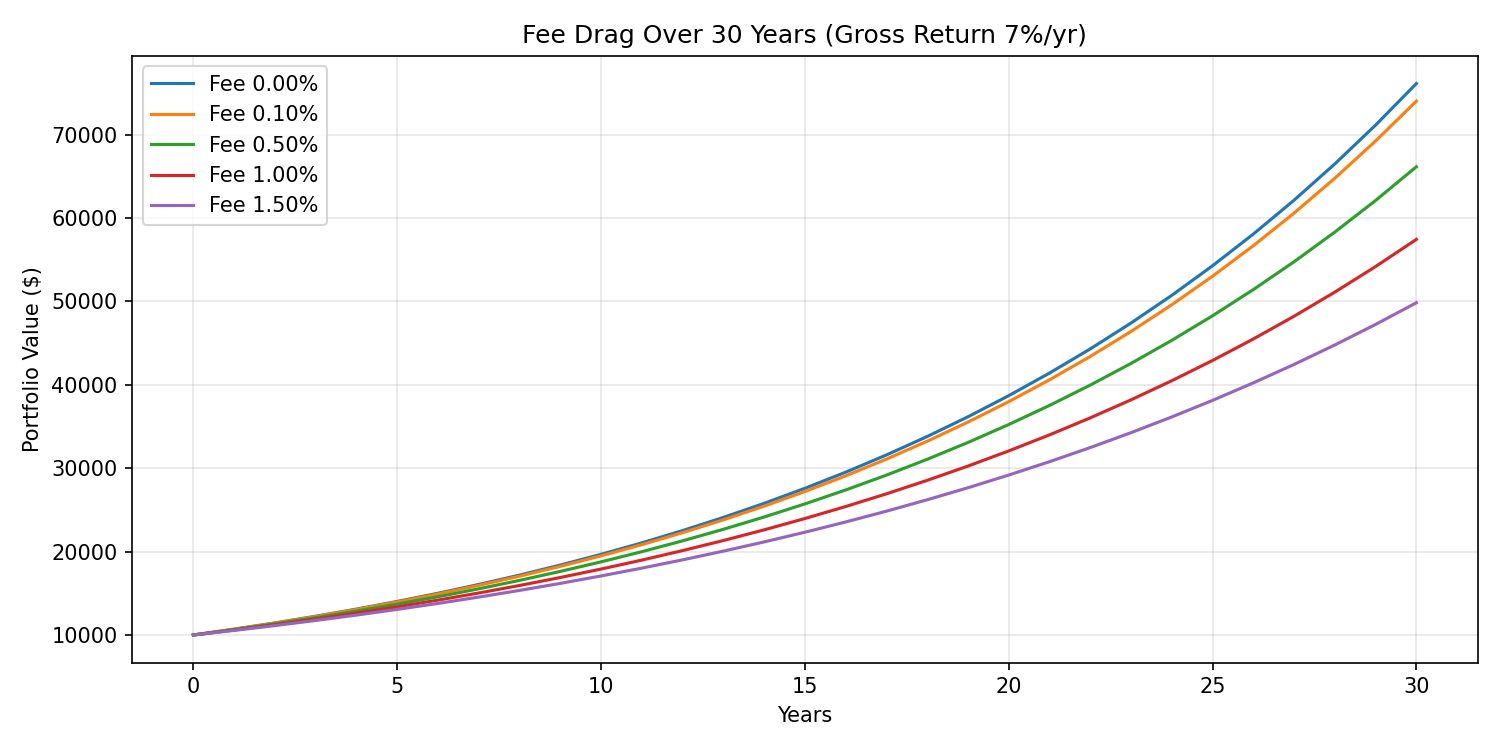
The chart keeps the market return fixed at 7%/yr and only changes the fee. Each line starts at \$10,000 and grows for 30 years; the higher the fee, the more the line lags. Notice how the gap is tiny at first and becomes large late in the period — that’s compounding at work.
Ending values at year 30
| Fee | 0.00% | 0.10% | 0.50% | 1.00% | 1.50% |
|---|---|---|---|---|---|
| Ending $ | 76,123 | 74,017 | 66,144 | 57,435 | 49,840 |
Wealth lost vs 0.00% fee
| Fee | 0.00% | 0.10% | 0.50% | 1.00% | 1.50% |
|---|---|---|---|---|---|
| Lost $ | 0 | 2,106 | 9,979 | 18,688 | 26,283 |
These tables translate the picture into dollars. The “Lost \$” row tells you how much less you end up with purely due to fees — same market, same timeframe.
Figure B — Fee drag on real SPY returns (since 2000)
Here we take SPY’s daily total-return proxy (Adjusted Close) and apply synthetic fees of 0.10%, 0.50%, and 1.00% per year. Using Adjusted Close matters because it includes dividends; that’s closer to what investors actually experience.
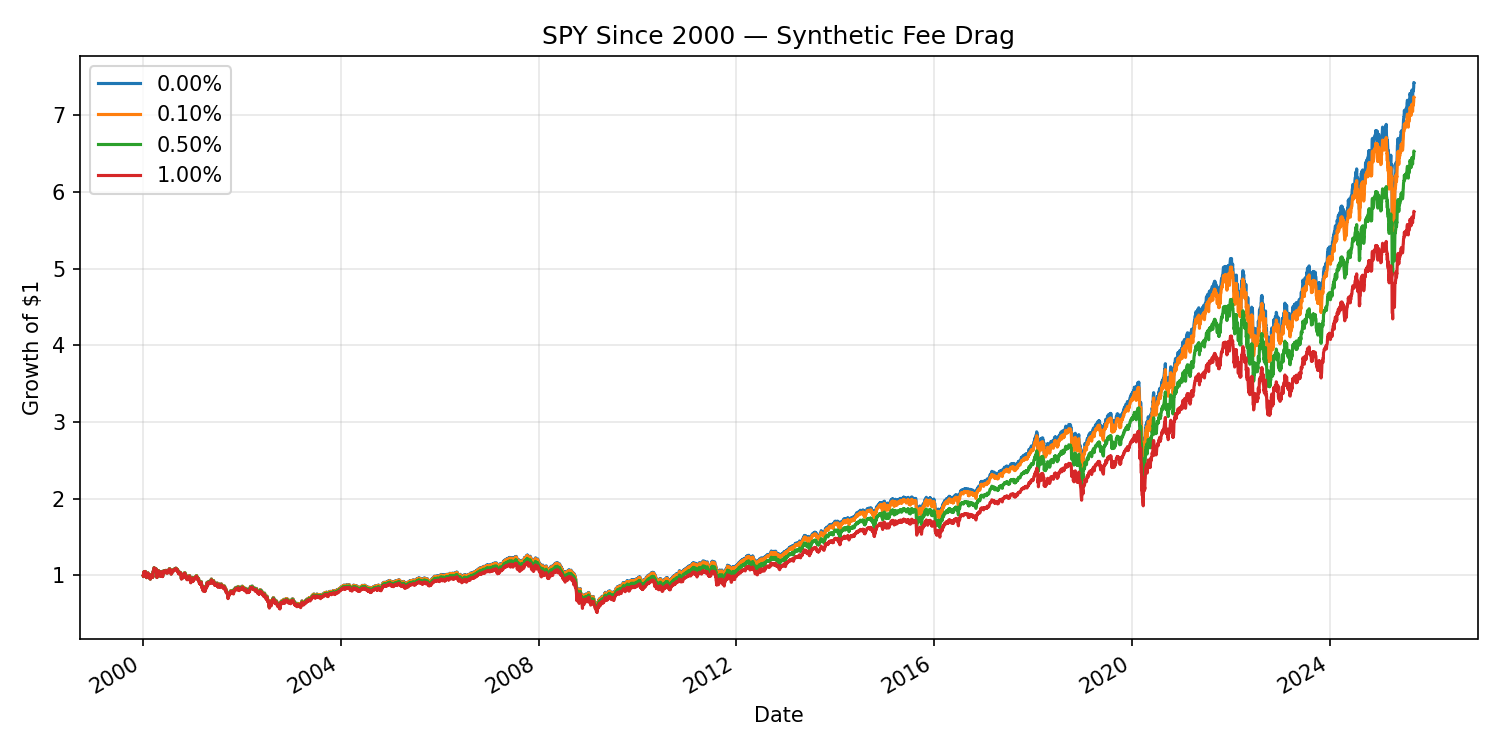
What you’re seeing: we compute SPY’s daily returns and then subtract a tiny slice each day to represent an annual fee (e.g., 1.00%/yr ≈ 0.01/252 per trading day). Day by day this is barely visible, but the cumulative effect is obvious in the growth curves.
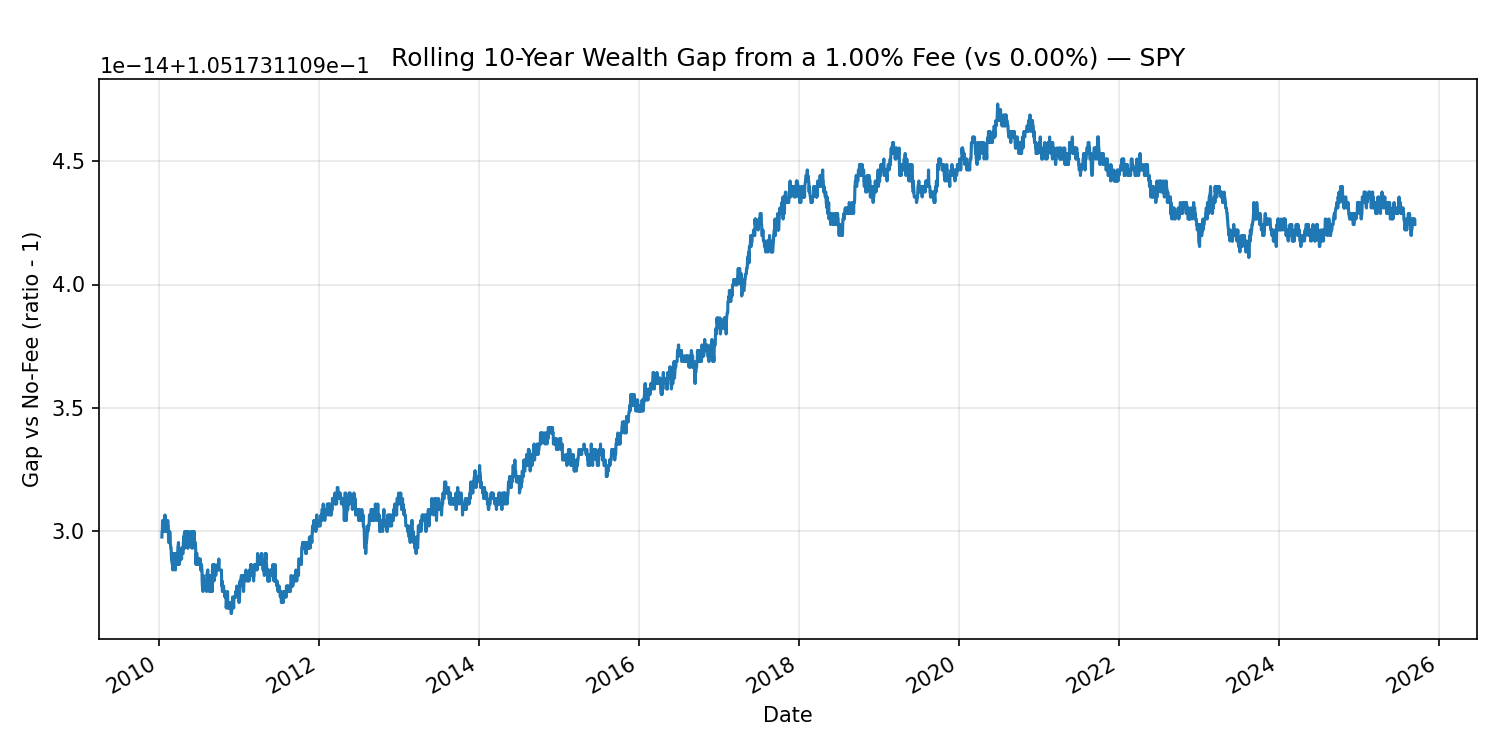
This second chart doesn’t look at the whole period at once. Instead, it rolls through many 10-year windows and asks: “If two investors started 10 years ago — one paying 0% and one paying 1% — how big is the gap today?” It’s a practical way to see that fees matter in most decades, not just in cherry-picked periods.
Tip: To compare two real funds tracking the same index (e.g., different share classes/expense ratios), use one as the gross series and synthetically add the fee difference to visualize the expected drag. That isolates fees from other effects.
Actionable takeaways
- Prefer low-cost, broad ETFs for core holdings; they’ve already won the fee war. Lower fees mean more of each year’s return keeps compounding for you.
- Avoid layered fees: if you pay an advisor, choose lower-fee funds to keep total cost reasonable. It’s the all-in fee that counts.
- Trade less, automate more: fewer frictions and fewer timing mistakes. Automation also helps you avoid emotional switches that add hidden costs.
- Look at all-in cost: expense ratio + advisory/platform fees + trading impact. Small items add up; seeing the total keeps you honest.
How Libra Invest helps
- Stay passive, stay cheap: Disciplined rebalancing with cash flows first (dividends/new contributions) helps keep your target mix without unnecessary trades or taxes, and our portfolio view highlights the all-in cost so you can keep the compounding headwind as small as possible.