Markowitz vs Global Minimum-Variance (GMV)
Most of what matters in investing is how you combine assets, not which single fund “wins.”
Markowitz’s mean–variance framework is the classic way to combine assets; the Global Minimum-Variance (GMV) portfolio is its most robust, no-guesswork cousin.
This post explains both, in plain English, and shows how to read the two figures below. Use them to set expectations, pick a mix you can live with, and understand where tools like Libra Invest add value.
The big idea (beginner-friendly)
- Assets don’t move in lockstep. Mixing them can lower total risk for the same expected return, or raise expected return for the same risk.
- The set of best risk/return trade-offs is the efficient frontier.
- Markowitz lets you pick any point on that frontier by trading expected return against risk.
- GMV sits at the far left of the frontier — the lowest-volatility diversified mix — and avoids forecasts entirely.
Think of the frontier as a map. Points on the curve are efficient, points above/right are strictly worse (more risk for the same return). The art is choosing where you want to stand on that curve.
The smallest amount of math you need
-
Portfolio risk: \( \sigma_p^2 = \mathbf{w}^\top \Sigma \mathbf{w} \)
(weights \( \mathbf{w} \), covariance \( \Sigma \)) -
Portfolio expected return: \( \mathbb{E}[R_p] = \mu^\top \mathbf{w} \)
Markowitz (long-only): choose the mix with the lowest variance for a target return
$$
\begin{aligned}
\min_{\mathbf w \ge 0}\quad & \mathbf w^\top \Sigma\, \mathbf w \
\text{s.t.}\quad & \mu^\top \mathbf w = R^*, \
& \mathbf 1^\top \mathbf w = 1 .
\end{aligned}
$$
GMV (global minimum-variance): choose the mix with the lowest variance, full stop
$$
\begin{aligned}
\min_{\mathbf w \ge 0}\quad & \mathbf w^\top \Sigma\, \mathbf w \
\text{s.t.}\quad & \mathbf 1^\top \mathbf w = 1 .
\end{aligned}
$$
What portfolios are we comparing (and what are the assets)?
Universe & building blocks (illustrative ETFs)
(You can substitute local equivalents; these are widely used, low-cost, and have long histories.)
- VTI — U.S. total stock market
- EFA — Developed markets ex-U.S. equity
- EEM — Emerging markets equity
- AGG — U.S. core investment-grade bonds
- TLT — Long-duration U.S. Treasuries
- VNQ — U.S. REITs (listed real estate)
- GLD — Gold
- DBC — Broad commodities
The four reference portfolios shown in the figures
-
GMV (Global Minimum-Variance).
The calmest diversified mix the data allows, using the assets above. In practice it tilts toward high-quality bonds (AGG, often some TLT), with smaller sleeves in equities (VTI/EFA/EEM) and sometimes diversifiers (VNQ/GLD/DBC) when they reduce co-movement. Exact weights depend on the period but the intent is consistent: minimize overall volatility while staying invested across assets. -
Max-Sharpe (a Markowitz point).
The portfolio on the frontier with the steepest risk/return trade-off (highest expected return per unit of risk). It typically leans more into equities (VTI, EFA, EEM) and adds diversifiers that help the ratio. Expect a punchier ride than GMV. -
Equal-Weight.
A simple benchmark: equal slices of all building blocks above (i.e., 1/N). Useful as a “no-knobs” comparison to see whether optimization meaningfully improves the risk/return mix. -
“60/40-ish”.
A familiar anchor for many investors: ~60% stocks / ~40% bonds. In the figures this is represented as 40% VTI, 20% EFA, 40% AGG (no EM, REITs, gold, or commodities). It’s not an optimization—just a clear reference point.
All portfolios are long-only and fully invested (weights sum to 1). The examples above are for education; real-world availability, taxes, and account type matter.
Figure A — The efficient frontier (how to read it)
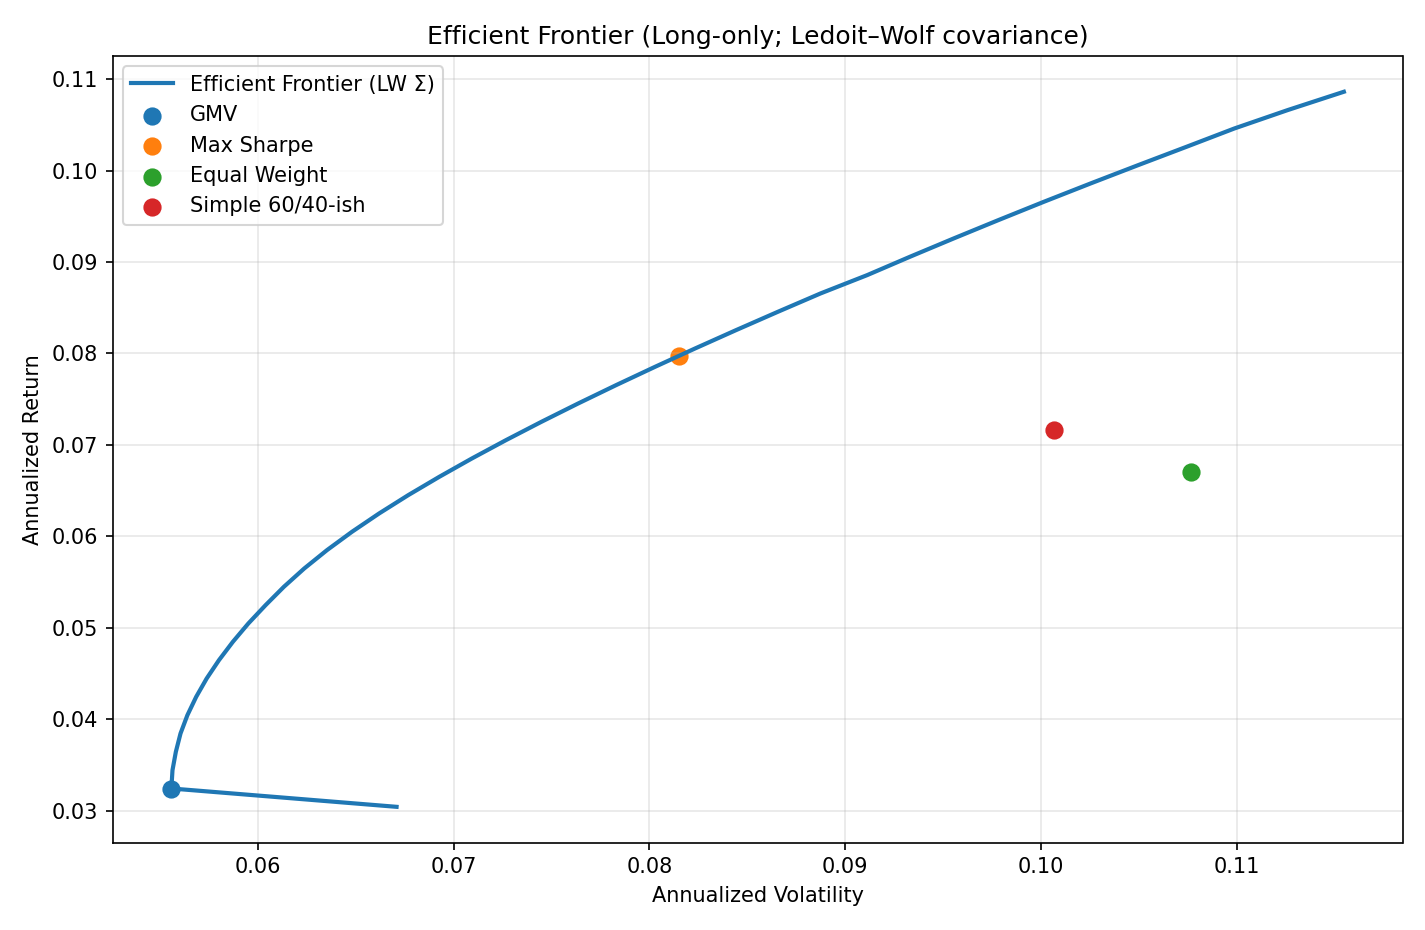
Interpretation tips
- Left → right = more volatility; bottom → top = higher expected return.
- GMV is ideal if you want the quietest ride while staying diversified.
- Max-Sharpe typically leans more into higher-return sleeves; it may be choppier.
- Small gaps between points aren’t decisive — inputs are noisy. Focus on the broad positioning (calmer vs punchier).
Figure B — What the ride felt like
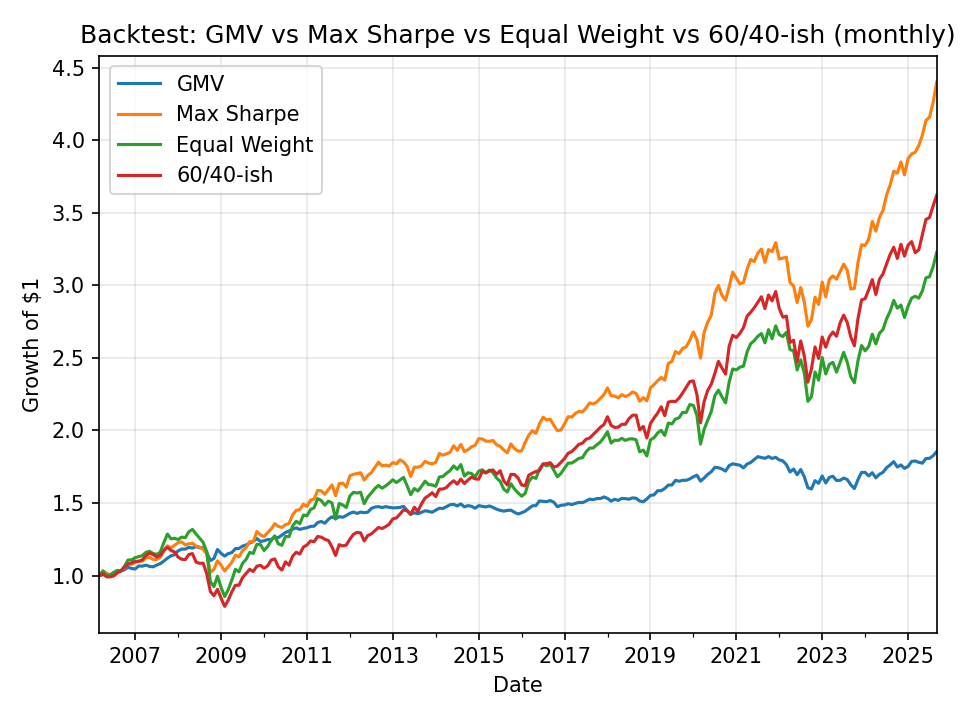
What to look for
- Drawdown depth: Would you have slept at night?
- Consistency: A steadier line that you can stick with often beats a jumpier one you can’t.
- Regime sensitivity: Expect different leaders when bonds, commodities, or certain equity regions have their moment.
Which should you use?
Choose GMV if…
- You value stability and want diversification without forecasting.
- You want a conservative core that pairs well with a cap-weighted equity fund.
Choose a Markowitz point if…
- You want to fine-tune around a passive baseline (e.g., aim for a specific volatility or slightly higher expected return).
- You accept that results are more sensitive to period and assumptions; keep sensible constraints and review drawdowns.
Not sure? Start with GMV (or a simple 60/40). They’re easier to live with, and behavior — staying the course — is the real edge.
Common pitfalls (and how to avoid them)
-
Noisy inputs → extreme weights.
Prefer diversified universes, long-only constraints, and stabilized risk estimates (professional tools apply shrinkage to reduce noise). -
Over-confidence in return forecasts.
Treat expected returns as a gentle guide, not gospel. GMV avoids them entirely. -
Turnover & taxes.
Rebalance annually (or with bands) and use new cash/dividends first. -
Overfitting to a lucky decade.
Read the charts qualitatively (calmer vs punchier) rather than fixating on tiny return differences.
A quick, practical checklist
- Pick a small, broad ETF set (global stocks, high-quality bonds, plus a couple of diversifiers such as REITs or commodities if they fit your plan).
- Decide your lane: GMV for the calmest diversified core, or a frontier point that matches your risk appetite.
- Write one sentence: “I hold [chosen mix], rebalance annually with ±bands, and use new cash first.”
- Review once or twice a year; ignore the day-to-day noise.
How Libra Invest helps
- Risk clarity without jargon: stabilized risk estimates, efficient-frontier views, and plain-language takeaways.
- Guardrails by default: long-only, sensible caps, turnover awareness — so “optimal” also means implementable.
- Discipline tools: calendar/band rebalancing using cash flows first, with explanations that make the plan stick.
Have questions about how your current holdings map onto the frontier? Libra Invest can analyze your mix, show your position, and suggest gentle, low-cost improvements.